
If you have found your profile that makes a lot sing on your sample roaster, loaded 12 kg of the same green into your production machine, copied the temperatures and produced something scorched and flat, you have met the most common frustration in roasting — and neither machine is at fault. Roast profile scaling fails when a curve is treated as numbers instead of a structure. Here is the method our engineers use at commissioning.
Why a Curve Cannot Simply Be Copied
Thermal mass ratio. A 300 g sample drum may weigh 3-5 kg, a drum-to-charge mass ratio around 10-16:1. A 15 kg production drum weighing 70-90 kg gives a ratio nearer 5-6:1. Your sample machine is dominated by stored steel heat, your production machine by live burner heat, so charging the big drum at the small machine’s charge temperature leaves you without the stored energy to carry the drying phase.
Surface-area-to-volume. A thin bean bed puts every bean against hot steel frequently. A deep production bed insulates its own core, so conduction matters less and convection more. The bigger the machine, the more the roast is driven by hot gas rather than drum contact — our comparison of drum versus fluid-bed roasters covers the underlying physics.
Airflow path. Sample roasters move a lot of air relative to a small bean mass and behave partly like fluid-bed machines; production drums move proportionally less air through a much denser bed.
Probe position and response. A sample probe sits in a shallow bed and responds in seconds. A production probe sits in a deep bed, often with a thicker sheath, and may lag 10-25 seconds. Two machines can both read “205 °C” while the beans are in genuinely different states — this alone explains a large share of the failed scale-ups you will read about.
What Transfers and What Does Not
Split your profile into two columns before you touch your production machine.
Transferable: the relative structure of the roast — turning point as a fraction of total time, the split between drying, Maillard and development phases (for example 45% / 35% / 20%), the development time ratio (DTR), the shape of the rate-of-rise decline, and the flavour target itself.
Not transferable: absolute charge temperature, burner percentage or gas pressure, damper position, time to first crack, and drop temperature. Copying a 196 °C drop temperature from a 200 g sample machine onto a 30 kg drum compares two different measurements that happen to share a unit.
Typical Milestone Ranges by Machine Size
Use these as sanity bands for your own machines, not targets. They are the ranges we see across commissioning jobs for a medium-density washed Arabica at a filter roast level.
| Machine size | Turning point | First crack | Total time | DTR |
|---|---|---|---|---|
| Sample 100-600 g | 0:30-0:50 | 5:30-7:00 | 7:00-9:00 | 15-20% |
| 1-3 kg | 0:50-1:15 | 7:00-9:00 | 8:30-11:00 | 17-22% |
| 6-12 kg | 1:00-1:30 | 8:00-10:30 | 10:00-13:00 | 18-23% |
| 30 kg and above | 1:20-2:00 | 9:30-13:00 | 12:00-16:00 | 18-25% |
Notice the pattern: as the machine grows, every absolute number stretches, but DTR stays inside a narrow band. That is precisely why DTR and phase percentages are the currency of scaling, and absolute clock times are not.
A Five-Step Scaling Method
Step 1 — Fix the flavour target on your sample machine. Roast the lot two or three ways, cup them, choose a winner, and record that batch completely: charge weight, charge temperature, turning point, dry end, first crack, drop and the full curve. It defines taste, not settings.
Step 2 — Convert the reference into percentages. Express each phase as a fraction of total roast time and write down DTR. If an 8:00 sample roast reached dry end at 3:40 (46%), first crack at 6:30 (81%) and dropped at 8:00, development is 19% and Maillard 35%. Those numbers travel with you; the temperatures stay behind.
Step 3 — Establish a baseline on your production machine. Never scale onto a roaster you have not characterised. Run two or three batches of ordinary, inexpensive coffee at your intended batch size with a middle-of-the-road charge temperature and steady burner, purely to learn how far the turning point falls, how long burner changes take to appear at the bean probe, and how ROR declines when you do nothing. Our commissioning and drum seasoning notes cover the first-week routine.
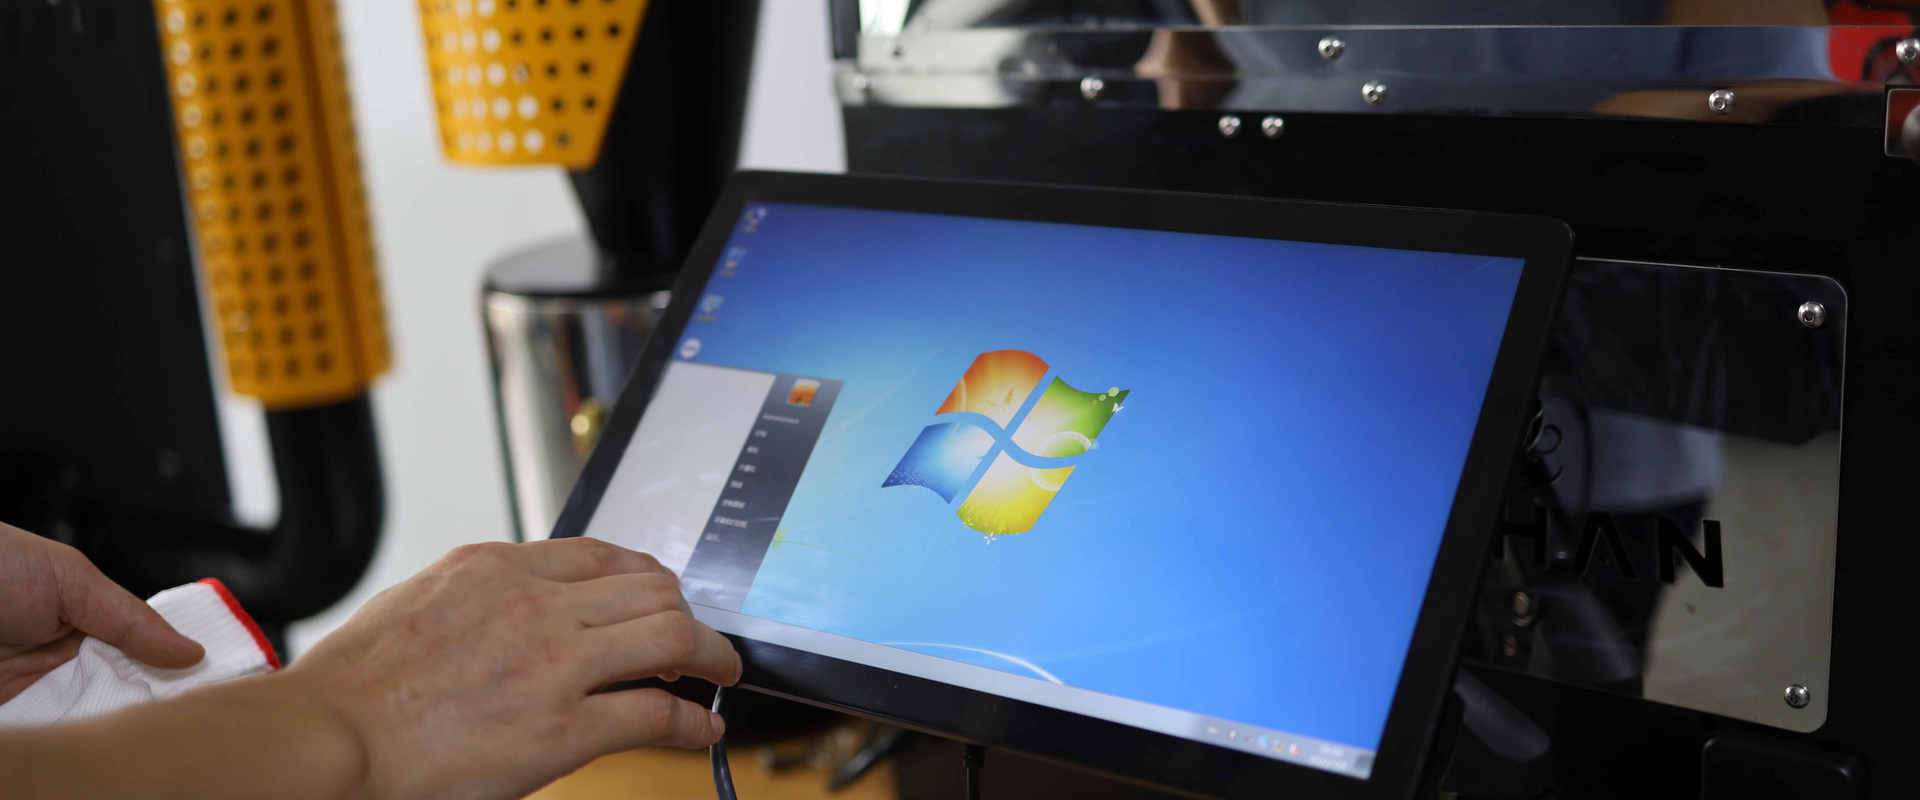
Step 4 — Back-calculate the heat application. Choose a realistic total roast time from the table above, then place your phase percentages onto that timeline. Targeting 11:00 total at 19% DTR puts first crack near 8:55 and dry end near 5:00. Now work backwards: what charge temperature and burner curve reaches dry end at 5:00 without an ROR crash? Adjust charge temperature in 5-8 °C steps and gas in 5-10% steps. Machines with recipe automation — our YS series with Siemens PLC executes a stored curve automatically — repeat the setpoint sequence identically batch after batch, removing operator variance from the experiment. See PLC roaster automation.
Step 5 — Converge in three to five batches. Change one variable per batch: batch one usually lands 30-60 seconds off, batch two corrects charge temperature, batch three the mid-roast burner curve, batch four or five is production-ready. Cup them side by side against the sample-machine reference rather than judging the curve alone — the curve says what happened, the cup says whether it was right. Our roast profile development guide covers that loop in more depth.
Batch Size Is Part of the Profile
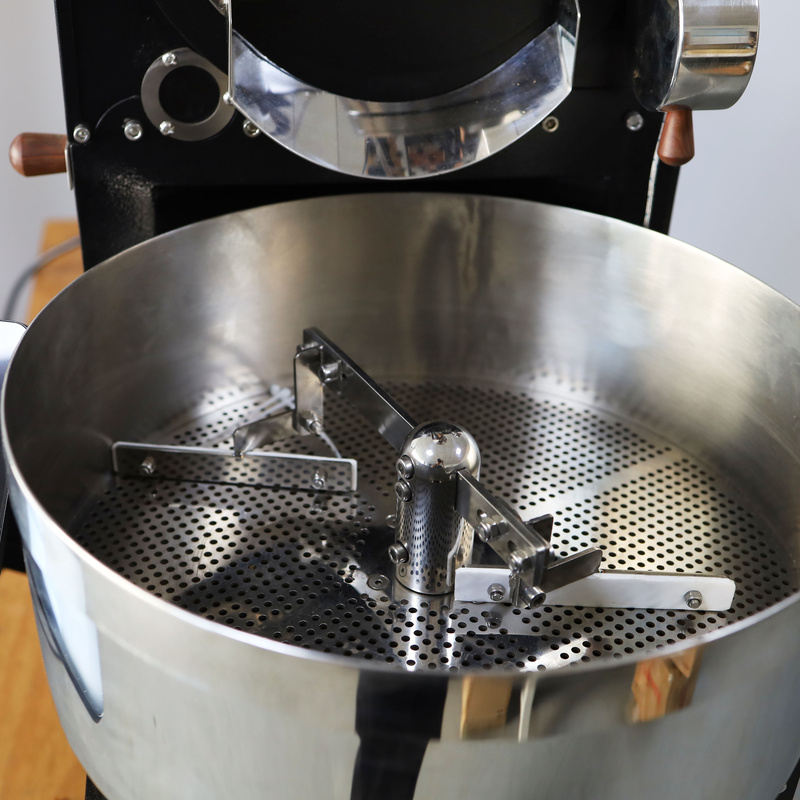
Scaling is not only about machine size but about how full the drum is. A production roaster at 30-40% of rated capacity behaves like a different machine: thin bed, high heat per bean, tipping and scorching risk, and a turning point so shallow the whole curve shifts. Keep production batches between 60% and 90% of rated capacity, ideally 70-80%, and never reproduce a sample profile on a drum loaded below 50%. If you routinely need very small production batches, buy a smaller machine rather than underloading a large one — the arithmetic is in our batch size guide and the model ranges on the commercial roasters page.
Overlaying Curves in Artisan
Scaling without data logging is guesswork, and you will pay for it in green coffee. Artisan lets you load the sample-machine reference as a background curve and roast the production batch against it live, so at 4:00 you can see you are 20 seconds and 6 °C behind and correct while it still matters. Two notes from our support desk. First, chase the background curve’s phase boundaries, not its absolute temperatures. Second, if Artisan will not hold a connection, stop fighting Bluetooth — intermittent pairing and mid-batch dropouts are common, and a wired USB connection to the controller solves it in nearly every case. Setup is in our Artisan connection guide; all digitally controlled Yoshan machines support Artisan logging.
Two Failure Modes to Recognise
The first is copying temperatures: a 200 °C charge taken from a sample drum onto a heavy, oil-seasoned production drum scorches the flat face of the bean and gives a burnt-caramel harshness. The second is copying burner percentage: 40% that carried 300 g beautifully is nowhere near enough energy for 12 kg, so ROR collapses between 150 °C and 180 °C and you get a baked, bready, hollow cup from normal-looking beans.
When It Is Worth Buying a Sample Roaster
If you buy green in container or multi-bag lots, a sample roaster pays for itself on your first rejected lot. It also protects production capacity: developing a profile on a 30 kg machine costs 30 kg of coffee per experiment, while a 100-300 g sample batch costs almost nothing and can be turned around in ten minutes. Our EC-500G electric sample roaster uses PID control across a 100-600 g charge range for repeatable evaluation work — details on the sample roasters page and in our guide to choosing a sample coffee roaster. The pairing we recommend for a growing roastery is one sample machine for buying decisions plus a production drum sized to 18-24 months of forecast demand.
Frequently Asked Questions
Does the method work going the other way — production to sample?
Yes, and it is worth doing when you want the sample roaster to predict what production will taste like. Take the production reference, convert it to phase percentages and DTR, and rebuild it on the sample drum with a lower charge and gentler burner; your sample machine's fast probe will show the structure more sharply than the production probe did. Cup both side by side and you have a calibrated sample bench.
Can a PLC machine copy your profile automatically?
It can run the same setpoint sequence every batch, which removes operator variance from the experiment — but it cannot know the drum it is running on. You still convert the sample profile to percentages and rebuild the absolute settings on your production machine; what the PLC does is repeat batch three exactly on batch four, so convergence takes three to five batches rather than ten. Recipe automation is a tool for the method, not a substitute.
What if my production drum is a different heating type from the sample?
Expect the drying phase to move most. An electric sample roaster delivers gentle, steady heat; a gas drum delivers a burner you can turn up fast, and a cast-iron drum stores heat between batches. The phase percentages still travel; the charge temperature and early burner curve will differ more than between two gas drums, so give step three — the baseline on the production machine — an extra batch.
How do I scale a profile for a coffee I have never roasted on the big drum?
Start from the closest coffee you have already scaled — same process, similar density and screen — and use its production settings as the baseline rather than the generic one. Then run the five steps with the new coffee's sample-roast percentages. Density is the variable that moves settings most, so log green density at intake; the cupping lab guide covers the intake numbers.
Which machines should I pair for sample and production work?
A sample roaster with digital control at 100–600 g for buying decisions and profile work — the EC-500G at USD 1,699, or the SD 100G Plus at USD 899 for cupping — with a production drum one size above today's kilos, loaded at 70–80%: an SD-6 Pro at USD 12,999 with loader, a YS-12 at USD 9,980, or whichever your volume supports. Both log to Artisan, so your curves overlay.
Final Thoughts
Roast profile scaling is a translation, not a copy: the phase percentages and development ratio travel between machines, the temperatures and burner settings stay behind. Fix the flavour on the sample drum, convert to percentages, build a baseline on the production machine, back-calculate the heat, and converge in three to five batches with the cups side by side. Send us your sample machine and target volume for a pairing. Talk to our engineers.
Get a Quote → WhatsApp +86 184 0771 4607Last updated: September 23, 2026
Pingback: Sample Coffee Roaster: 100 g or 500 g, and Why It Matters | Yoshan
Pingback: PLC Coffee Roaster Automation: What It Does for You and What It Cannot | Yoshan
Pingback: 1 kg Coffee Roaster: Three Machines, One Question | Yoshan
Pingback: Probat Alternative: Where the Brand Wins, Where It Does Not | Yoshan
Pingback: Manual vs Semi-Automatic vs Fully Automatic Coffee Roaster
Pingback: Bean Temperature vs Exhaust Temperature on a Coffee Roaster
Pingback: 10kg Coffee Roaster: What It Produces, Why Ours Is 12 kg | Yoshan